


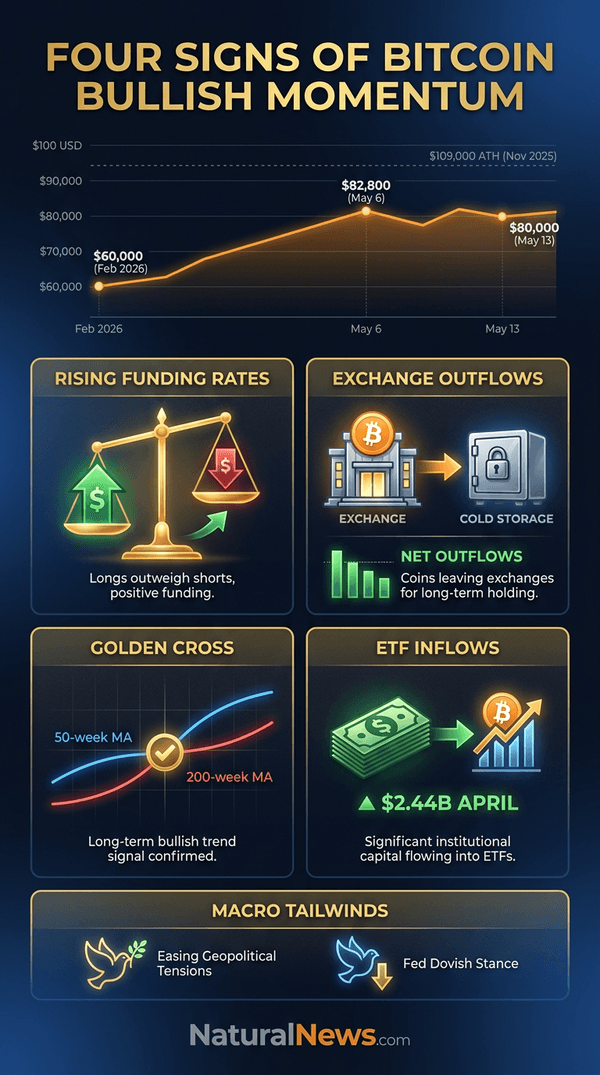
The indicators include rising funding rates, persistent exchange outflows, a bullish "golden cross" on the weekly chart, and a rebound in institutional inflows via spot exchange-traded funds. As of May 13, 2026, Bitcoin traded near $80,000, down slightly from a multi-month high of $82,800 reached on May 6, but still well above levels seen during a correction earlier in the year. [1]
Bitcoin's price performance in 2026 has been volatile. The asset reached an all-time high near $109,000 in November 2025 following the inauguration of President Donald Trump, then experienced a sharp correction that saw it drop to around $60,000 in February 2026. [2] [3] Analysts now say the market may have entered a new expansion phase. [1]
1. Funding Rates Turn Positive After Correction
Bitcoin perpetual swap funding rates have shifted positive across major exchanges, indicating that long-position traders are now paying shorts to maintain their positions, according to data cited in the report. [1] The shift signals renewed confidence among leveraged traders, who had been reluctant to open long positions during the prolonged consolidation phase. The "Cryptocurrency QuickStart Guide" notes that funding rates serve as a barometer for market sentiment in derivatives markets. [4]
CryptoQuant CEO Ki Young Ju, commenting on the data, cautioned that elevated funding rates could sometimes precede short-term pullbacks if the move is not accompanied by spot buying. [1] The report also pointed to an increase in open interest as a supporting indicator. Analysts emphasized that funding rate trends should be viewed alongside spot market activity to avoid false signals.
2. Exchange Netflows Show Persistent Outflows
On-chain data from Glassnode reveals that Bitcoin exchange netflows have been consistently negative over the past two weeks, meaning more coins are leaving exchanges than entering. [1] This pattern is typically interpreted as accumulation by holders moving coins to cold storage, which reduces available supply on trading platforms. The "Cryptocurrency QuickStart Guide" explains that such outflows can reduce selling pressure and support price appreciation. [4]
Analyst James Check stated, "When coins leave exchanges in sustained fashion, it typically supports price appreciation because sellers are removed from the market." [1] The outflows coincide with broader positive sentiment as geopolitical tensions in the Middle East have eased, allowing risk assets to recover. [5]
3. Weekly Golden Cross Emerges on BTC Chart
Bitcoin's 50-week moving average has crossed above its 200-week moving average, forming a "golden cross" on the weekly timeframe, according to TradingView data cited in the report. [1] This technical event has historically preceded extended bull runs, including major rallies in 2017 and 2020. Market analyst Rekt Capital noted that weekly golden crosses have had a strong track record in signaling sustained upward trends, though past performance does not guarantee future results. [1]
The golden cross formation comes as Bitcoin's price has reclaimed levels above its bull market support band, further reinforcing the bullish technical outlook. [1] Some analysts caution, however, that similar patterns have produced false signals in volatile markets, and confirmation from on-chain data is essential.
4. Institutional Demand Rebounds via Spot ETFs
U.S. spot Bitcoin exchange-traded funds recorded $2.44 billion in net inflows in April, the strongest monthly figure since October 2025, according to data from Bloomberg. [6] The inflows reversed the outflows seen in the first quarter of 2026 and were led by Fidelity's FBTC and BlackRock's IBIT. Bloomberg ETF analyst Eric Balchunas said, "The recent inflow pattern suggests institutions are reallocating into Bitcoin after a pause, which is a positive signal for momentum." [6]
The resurgence in institutional demand coincides with a broader shift in macroeconomic conditions. Easing geopolitical tensions and a dovish stance from the Federal Reserve have encouraged risk-on positioning. [7] Wall Street firms such as Goldman Sachs have indicated that Bitcoin's prolonged consolidation may have marked a market bottom, with "volatile but flattish performance" and attractive valuations cited as reasons for renewed interest. [8]
Outlook: Uncertainty Remains Despite Bullish Signals
While the four indicators point to renewed bullish momentum, analysts caution that macro factors could alter the trajectory. The Federal Reserve's interest rate policy remains a key variable; Chairman Jerome Powell has signaled that further rate cuts are not guaranteed, which could dampen risk appetite. [7] Additionally, regulatory developments and potential shifts in trade policy under the Trump administration introduce uncertainty. [2]
Some market observers warn that a failure to break above the $82,800 resistance level could lead to a false signal and renewed selling. [1] According to the report, the market remains in a "wait-and-see" phase ahead of upcoming U.S. inflation data, which could provide the next major catalyst. [1] Analysts emphasize that while the technical picture has improved, sustained bullish momentum requires continued institutional participation and favorable macroeconomic conditions.
References
- Nancy Lubale. "Four Signs That Bitcoin Has Recovered To 'Full' Bullish Momentum." CoinTelegraph.com via ZeroHedge. May 13, 2026.
- Lance D. Johnson. "Trump's crypto friendly Presidency sparks optimism and uncertainty in digital asset markets." NaturalNews.com. January 23, 2025.
- Patrick Lewis. "Bitcoin's rollercoaster: Flash crash to 60000 sparks panic before sharp rebound." NaturalNews.com. February 9, 2026.
- Hybrid Tech. "Cryptocurrency QuickStart Guide: Learn about Wallets, Coin, Exchanges, Trading, Usage and much more."
- "Bitcoin Price Tops $77,000 Amid Strait of Hormuz Reopening Announcement." NaturalNews.com. April 20, 2026.
- "Bitcoin Price Tops $81,000 for the First Time Since January 2026." NaturalNews.com. May 7, 2026.
- "Bitcoin's rollercoaster ride: Fed rate cut sparks volatility as Powell signals caution." NaturalNews.com. November 3, 2025.
- Cassie B. "Wall Street giants signal bitcoin may have found its floor after months of decline." NaturalNews.com. March 27, 2026.
Explainer Infographic


Please contact us for more information.


